Theory vs. Practice
Diagnosis is not the end, but the beginning of practice.
› What makes something "faster"?
There is now not a week without someone new claiming that they have a server "faster than G-WAN".
The good news is that G-WAN became the "reference-to-beat" for everyone. The bad news is that – every single time – these claims are backed by tests that show G-WAN performing between 15k and 150k requests per second (whatever the number of CPU Cores).
The "why" is so obvious that it is really entertaining.
The devil is in the details
These tests have a few things in common:
- the total lack of rounds,
- the total lack of concurrency range,
- the total lack of performance.
Let's see why, one item after another:
- Rounds are mandatory because you will never get the same results in two consecutive shots of weighttp (those using the single-threaded ApacheBench on a multi-threaded server are not even worth considering). So, something like 10 rounds (the value used in all G-WAN tests) give you a minimum, an average and a maximum (rather than one single arbitrarily chosen value).
- A concurrency range is also needed: one server may shine at 10 requests per second and die at 1,000 requests per second – or it may pass those two shots but not perform well a long test covering a large [0-1,000] concurrency range (the one used in G-WAN tests).
- Performance seems to be a mandatory key element in a "performance" test. But you will see many "faster" servers producing benchmarks that top at... 200,000 requests per second (or lower). Given the fact that G-WAN tops at 860,000 requests per second (on a 6-Core CPU), one could question how they can seriously claim to be "faster".
A story of multi-Cores
When people who make bold claims know that they are right, they take an inordinate amount of time and energy at making it clear that the way they tested their work is undisputable. You will see all the information above, documented tests (client, hardware, command-line, OS, OS tuning options, configuration files, etc.), with many clean charts and dozens of versions tested during months if not years (G-WAN published many updated charts since its first public release in June 2009).
When you see guys publishing drafts, incomplete details, big titles without substance, and obvious broken tests, then this may be because they are much less sure that they are right – and there is an easy way to check this point: asking the missing details.
At this point they quickly get nervous, they want to change of subject, they censor you, or they claim that you are a troll – all that violence for someone merely asking how their test was done.
For them, denial is easier than doing the right thing.
The 200k wall
It is difficult to scale on multi-Core CPUs. And, if you don't scale, then your server will block around the 200,000 requests/second wall (when limited to and tested on 1 CPU Core, G-WAN gives 250,000 requests per second):
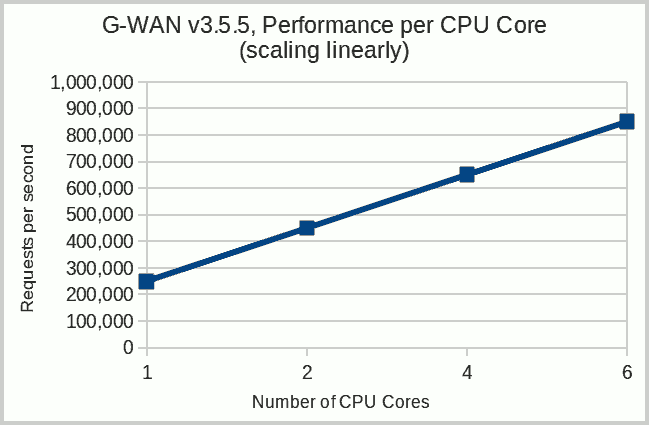
| server | client | memory footprint | scalability (100-byte file) |
|---|---|---|---|
| ./gwan -w 1 (1 worker) | weighttp -t 1 (1 worker) | 1.2 MB RAM | 250,000 requests/sec. |
| ./gwan -w 2 (2 workers) | weighttp -t 2 (2 workers) | 3.2 MB RAM | 450,000 requests/sec. |
| ./gwan -w 4 (4 workers) | weighttp -t 4 (4 workers) | 5.2 MB RAM | 650,000 requests/sec. |
| ./gwan -w 6 (6 workers) | weighttp -t 6 (6 workers) | 7.2 MB RAM | 850,000 requests/sec. |
That explains why those servers "faster than G-WAN" always publish tests where G-WAN is presented as being ridiculously slow. This is the fun part of the story: G-WAN must absolutely stay under the 200k wall for the other "faster-servers-that-do-not-scale" to merely exist.
If, one day, you see a Web server able to handle 850,000 requests/second on one 6-Core CPU (like G-WAN), then drop me a line.
In the meantime, G-WAN is the "fastest" server. G-WAN never stopped to be faster than itself, each version being faster than the previous (and therefore faster than all those other servers which are not able to fully-use multi-Core CPUs).
Being at the top during years requires a bit of insight – the kind that is difficult to beat by merely buying favorable exposure.
update: the (creative) 2.5m wall
Following the post above, someone pointed yet another intriguing test, made by someone known for his recurring pathologic 'errors'.
Here is his latest bar chart made with my ab.c 100-byte test. And the results are as follows (for the test authors' server, G-WAN 3.2.24 64-bit and Nginx 1.1.16)... on a Pentium 4 CPU:
- server 1 gives 2.3 millions of requests/second
- server 2 gives 0.5 millions of requests/second
- server 3 gives 1.8 millions of requests/second
You read well. The venerable Pentium 4 (Passmark score: 414) was designed in 2001, that's the last single-Core CPU made by Intel, but with some generous creative accounting, it outdoes by a factor 3 recent 6-Core CPUs (Passmark score: 10,047). Manufacturers like Intel would have saved billions in R&D... that is, if the above claims had any resemblance to reality.
Unfortunately, looking at the data set allows us to see that this bar chart does not rely on anything related to reality:
- the 2.3 million claim is not backed by 2,300,000 but rather by 682,230 requests,
- the 682,230 number is the sum of all the 'average' requests (not the average/second),
- the chart calculations and its legend are not related to any kind of elapsed time.
So, the bar chart legend titled "average request for second - concurrency (1-1000)" (sic) does not match its data set which shows 682,230 as the sum of all the requests of the 'average' column. And they have been processed by this server in a total time of... 34 minutes and 36 seconds (instead of the advertised 1 second – see below a shortened version of the data set):
 ===============================================================================
 G-WAN ab.c ApacheBench wrapper, http://gwan.ch/source/ab.c
 -------------------------------------------------------------------------------
 Machine: 1 x 1-Core CPU(s) Intel(R) Pentium(R) 4 CPU 2.80GHz
 RAM: 1.59/1.93 (Free/Total, in GB)
 Linux x86_64 v#1 SMP Tue Feb 21 14:26:29 CET 2012 3.2.7

 > Collecting CPU/RAM stats for server 'userver_tcp': 3 process(es)
 pid[2]:2157 RAM: 4.19 MB
 pid[1]:2155 RAM: 4.19 MB
 pid[0]:2139 RAM: 8.92 MB

 weighttp -n 10000 -c [0-1000 step:10] -t 1 -k http://localhost:8080/100.html

  Client            Requests per second            CPU
 ----------- ------------------------------- ---------------- -------
 Concurrency    min        avg       max      user    kernel   MB RAM
 ----------- ---------  ---------  --------- -------  ------- -------
         1,    19797,     22263,     25973,     1,      3,     17.30
        10,    26296,     34436,     42347,     1,      1,     17.30
        20,    25043,     33067,     40913,     1,      2,     17.30
       ...
       250,    14049,     18808,     22101,     0,      3,     17.30
       260,      982,       984,       985,     0,      3,     17.30
       270,      982,       983,       985,     0,      5,     17.30
       ...
       980,      141,       196,       326,     0,      8,     17.30
       990,      141,       200,       326,     1,      8,     17.30
      1000,     141,       166,       326,    2,      8,     17.30
 -------------------------------------------------------------------------------
 min:523488 avg:682230 max:828300 Time:2076 second(s) [00:34:36]
 -------------------------------------------------------------------------------
 CPU jiffies: user:602 kernel:4286 total:4888
For a "requests per second" chart, the correct calculation, based on the total elapsed time, is:
(682,230 requests) / (100 samples) = 6,822 requests/second
So, this server, on average on the [1-1,000] concurrency range, gave 6,822 requests/second (if the numbers are legit).
That's a factor 337 away from the bogus 2.3 millions of requests/second rendered on the bar charts.
Now, just looking at the first lines of the G-WAN data set reveals that the test was... not identical:
 > Collecting CPU/RAM stats for server 'gwan': 2 process(es)
 pid[1]:2173 RAM: 4.78 MB
 pid[0]:2172 RAM: 0.65 MB

 ab -n 10000 -c [0-1000 step:10] -S -d -k http://localhost:8080/100.html
- Unlike ULib, G-WAN was not tested with the faster weighttp: G-WAN was tested with the older and much slower AB.
- G-WAN was loaded with 51 scripts and their corresponding C, C++, and Objective-C/C++ runtime libraries.
Were the G-WAN log files also 'inadvertantly' enabled, in the same spirit of 'fairness' that seems to govern this author?
And, finally, why test G-WAN, a server designed for multi-Core CPUs, on an obsolete 10-year-old single-Core CPU?
How many readers seeing the charts published on GitHub will be curious enough
to study the data sets to check the facts?
How many will spot the 'errors' and the different test conditions that benefit
to the server made by the author of the test?
How many severe errors are acceptable in such a comparative test before it
makes the test completely irrelevant?
Question Are those 'errors' accidental or a deliberate attempt to deceive readers?
Answer The main error has been notified to its author two weeks ago, and no reply nor any action took place to correct it:
From: Pierre
To: Stefano
Subject: G-WAN benchmarks
Date: Wed, 16 May 2012 09:37:14 +0200

Hello Stefano,

Someone pointed me to your AB tests published here:

https://github.com/stefanocasazza/ULib

The legend of your charts is wrong: this is not the
"average requests per second" that is charted.

What you are charting is the SUM of ALL the average
ROUNDS for each concurrency step on the 0-1,000 range
and this amount is NOT related to the time it takes
for a server to pass the test.

You could chart the "average requests per second" by
DIVIDING the SUM* that you are using BY THE number of
samples (1,000 concurrencies / 10 steps).

I believe that ULib would get a better exposure if
the charts were using the right legend, or the right
numbers.
Conclusion When 'errors' are (a) recurring, (b) not acknowledged and (c) not corrected then you can safely call it a 'strategy'.
This example illustrates why most tests are not documented: when a test exposes how it has been made, it is easy for others to identify how much creative accounting was involved.